SB 55, Right to Exploit
For almost a decade coloradans have rejected 'right to exploit' legislation, but right-wing politicians haven't gotten the hint

About so called 'Right to Work' bills and why they should be called 'Right to Exploit'
What is right to work anyway?
Right to work is a dangerous and divisive bill that politicians use to intervene in the rights of people like you and me to negotiate with our bosses as we see fit. The bill is championed by big companies, the same ones that ship jobs overseas, by taking away workers rights to organize and negotiate for fair paychecks and safety standards on the job. These companies argue that this will make states more competitive and attract jobs, but, in reality, that doesn’t happen and corporations are given the power to exploit their workers.
By many measures, quality of life is worse in states with right to work laws. Wages are lower, people are less likely to have health insurance and the necessary resources for a quality education, poverty levels are higher as are workplace fatality rates.

States with Right to Work Laws Have Lower Wages and Incomes
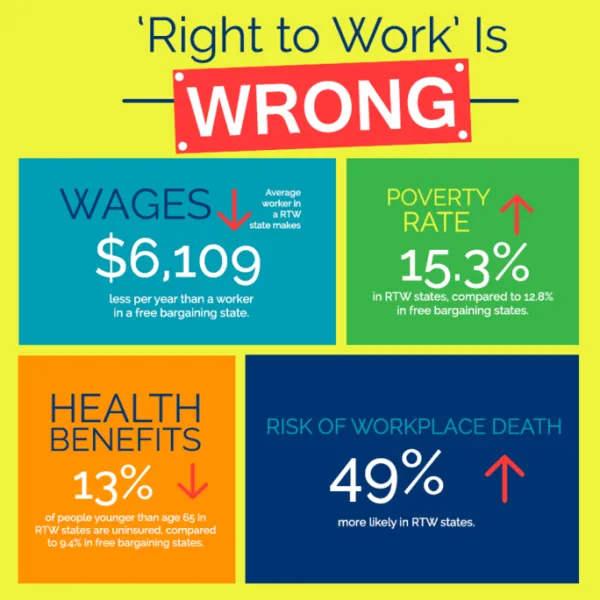
- On average, workers in states with right to work laws make $6,109 a year (12.1%) less annually than workers in other states ($44,401, compared with $50,511).1
- Median household income in states with these laws is $8,174 (13.9%) less than in other states ($50,712 vs. $58,886).2
- 29.6 percent of jobs in right to work states were in low-wage occupations, compared with 22.8% of jobs in other states.3
States with Right to Work Laws Have Lower Rates of Health Insurance Coverage
- People under the age of 65 in states with right to work laws are more likely to be uninsured (13.0%, compared with 9.4% in free-bargaining states).4
- Only 47% of private-sector employers in states with these laws offer insurance coverage to their employees, compared with 52.2% in other states.5 That difference is even more pronounced among employers with fewer than 50 workers: only 30.1% offer health insurance compared with 38.1% of small employers in other states.6
- Workers in right to work states also pay a larger share of their health insurance premiums, on average, than those in free-bargaining states (28.5% of the premium compared with 25.4% in free-bargaining states).7
States with Right to Work Laws Have Higher Poverty and Infant Mortality Rates
- Poverty rates are higher in states with right to work laws (15.3% overall and 21.4% for children), compared with poverty rates of 12.8% overall and 18.0% for children in states without these laws.8
- The infant mortality rate is 12.4% higher in states with right to work laws.9
States with Right to Work Laws Invest Less in Education
- States with right to work laws spend 32.5% less per pupil on elementary and secondary education than other states.10
States with Right to Work Laws Have Higher Workplace Fatality Rates
- The rate of workplace deaths is 49% higher in states with right to work laws, according to data from the Bureau of Labor Statistics.11
Right to work is wrong for your family-- whether you are union or not

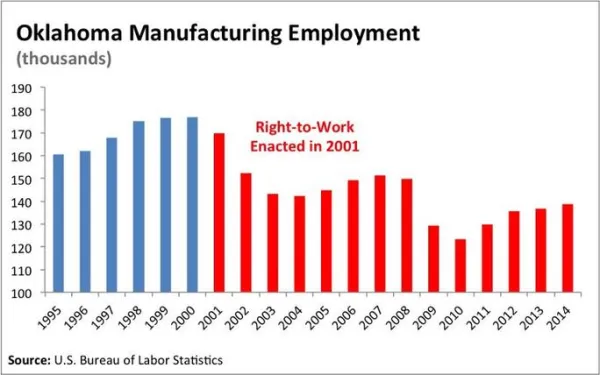
All evidence, actual facts, from non-partisan sources show that right to work doesn’t create jobs and actually has a negative effect on states’ economies. We saw this in Oklahoma. In the wake of right to work, the number of new companies relocating to our state has decreased by one-third and the number of manufacturing jobs has also fallen by a third. That’s according to the U.S. Bureau of Labor and Statistics. That same thing is happening in other right to work states as well, seven of the top 10 states with the highest unemployment are right to work states. Worse, the jobs that stay in right to work states are lower paid. On average, workers in right to work states make about $5,000 less a year than in other states.
That means everyone has less money to spend in the community.
That’s the thing that supporters of this bill don’t want you to know. This law takes money out of EVERYONE’s pockets. It means that you will be paid less, that you will have less to spend on groceries, in pharmacies, on going out to dinner or to the movies, on your hobbies and home improvement projects. It means that everyone that you personally interact with on a daily basis has less to spend, spends less and then can’t spend on other things…it’s a vicious cycle.
Worse, right to work means that our communities will be less safe.
Another thing that supporters of right to work don’t tell you is that nurses, teachers, firefighters, and police officers come together collectively to negotiate with politicians over the critical equipment they need to keep our communities safe. Nurses negotiate to ensure there are enough on staff working humane hours to respond when our lives are in danger in hospital emergency rooms. Firefighters negotiate for the equipment they need to safely and quickly put out fires. Police officers negotiate for new equipment to respond to violent emergencies. Teachers negotiate over class sizes. All of these critical negotiations by folks who know how to keep our community safe get threatened by the consequences of this bill.
Right to work is wrong for us and does not work
At the end of the day, all of the reasons that supporters give for this bill are not only false, but are deceiving us from the real reasons they want to pass these bills — to pad the profits of large corporations by allowing them to pay us less, work us more and prevent us from doing anything about it. It’s been 16 years since Oklahoma passed right to work and every single one of the promises made by supporters of the bill failed to materialize. In fact, for those of us who lost jobs after, and who were forced to watch our community suffer because of the bill, we are left wondering why anyone in power would let this happen. As with so many other things that have gotten out of control in our country, the only answer seems to be greed.
1 Bureau of Labor Statistics, Quarterly Census of Employment and Wages (all industries, all establishments, average annual pay), 2014 data. Numbers are rounded ($50,510.58 and $44,401.17).
2 U.S. Census Bureau, Table H-8. Median Household Income by State: 1984 to 2014.
3 CFED, Asset and Opportunity Scorecard, Low Wage Jobs, 2013.
4 Henry J. Kaiser Family Foundation, Health Insurance Coverage of Nonelderly 0–64.
5 Henry J. Kaiser Family Foundation, Percent of Private Sector Establishments that Offer Health Insurance to their Employees, 2013.
6 Henry J. Kaiser Family Foundation, Percent of Private Sector Establishments That Offer Health Insurance to their Employees, by firm size, 2013.
7 CFED, Employee Share of the Premium, 2014.
8 U.S. Census Bureau, POV46: Poverty Status by State: 2014 Below 100% and 50% of Poverty — All Ages; POV46: Poverty Status by State: 2014 Below 100% and 50% of Poverty — People Under 18 Years of Age, Weighted Person Count.
9 Henry J. Kaiser Family Foundation, Infant Mortality Rates (deaths per 1,000 live births), 2013.
10 National Education Association, Ranking & Estimates - Rankings of the States 2015 and Estimates of School Statistics 2016, Table H-11. Current Expenditures for Public K-12 Schools Per Student in Fall Enrollment, 2014-15 ($). Note: Wisconsin was excluded from the free-bargaining states vs. right to work state analysis for education spending because the state enacted its right to work law in 2015. The impact of right to work policies would not have been fully experienced in the 2014–2015 school year. In addition, West Virginia is included as a free bargaining state in this analysis of 2014–2015 school year data because the state passed right to work legislation in 2016.
11 Bureau of Labor Statistics, National Census of Fatal Occupational Injuries in 2014.
